Request information for
Product Offer Hero Title
Hello, thanks for your interest in investing with Downing. Please complete this form to receive the requested information.
Did you know. Risk warning. Take 2 mins to learn more.

None of the information provided is investment or tax advice.
You should always read the associated risks before deciding whether to invest. These can be found on the product pages as well as in our risks overview.
Please confirm you have read the information above.
Hello, thanks for your interest in investing with Downing. Please complete this form to receive the requested information.
Did you know. Risk warning. Take 2 mins to learn more.

I got excited on the phone to my bank last month, which was unusual for all sorts of reasons. What lit my sparkler? They told me I could switch up to £5k into an account paying 5% interest. The shock of them paying me anything, let alone 1% above the Bank of England’s Base Rate, caught me off guard.
Naturally I snatched it. What’s to lose?
Nothing. Not in that case, anyway. Switching in from my current account, where they continue to fleece me with a miserly 0.5%, was a no brainer.
But… That’s different to saying that holding cash today is a no brainer. It’s not. Although I’m finding more and more people who apparently think it is.
Well, whoa Nelly, I say to them. Clearly if you’re getting close to the Bank of England’s Base Rate of 4.25%[1] on your cash that’s better than nothing. But does it mean you should sell all your non-cash assets and stick it in the bank?
I can’t answer that for you, but I can for me: No; I shouldn’t. And here’s why.
For many of us, receiving 4% on cash is a nostalgia kick. It takes us back to when, if we weren’t comfortable with the stock market, or didn’t want to stick it in property, we could happily pop our money in the building society. There it would rub along nicely and, when we withdrew it, we could buy more stuff than when it went in.
That’s not the case today. Based on today’s conditions, if you put your money in an account paying 4%, you’ll be able to buy considerably less with it when you withdraw.
This is, of course, because we’ve been reunited with our old friend inflation. In our rational brains, we know that if inflation runs higher than the interest we’re paid, it chews up our spending power. But in our irrational hearts, we see 4% on a bank account and think; Whoop! The good times are back!
So let’s make this clear. Even if you were able to get the Base Rate of 4.25% on all your cash (a mammoth ‘if’), then you’re still on a real interest rate of -6.2%. In case the word “real” reads like jargon to you, it means “after inflation”, but you can consider it shorthand for “what really matters”. Because at 4.25% interest, if inflation were to stay at February’s level of 10.4%[2] for the next year, you’ll be able to buy five and a half per cent less stuff by this time in 2024.[3]

Based on latest Bank of England and ONS data.
So, if interest rates going back up above 4% feels like you’ve never had it so good, you should know that you’ve actually never had it so
Real interest rates are simply the interest rate minus the level of inflation. You can see on Chart 1, below, that today’s Base Rate of 4.25% is the same as in May 2004. But back then inflation was 1.5%, so your spending power was growing. Today inflation is 10.4%, so it’s shrinking, fast. Clearly this is no cause for cockahoopery.
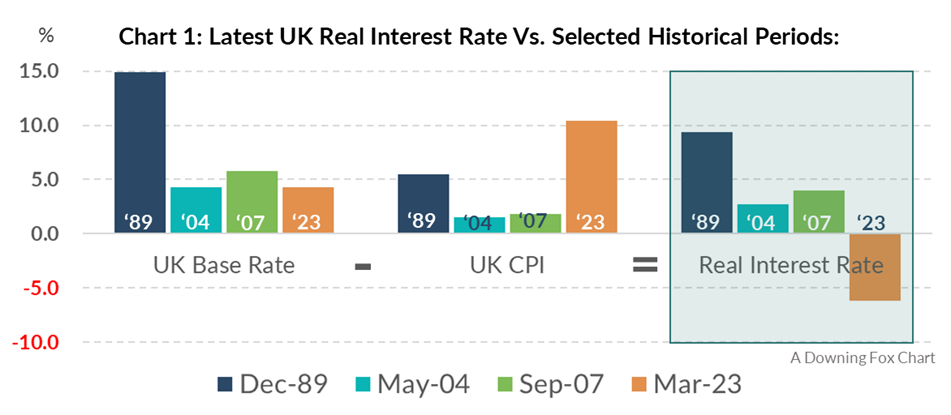
Chart 2, below, is how real interest rates have moved over time (since the start of CPI). The green bars at the bottom explain why those of us who worked in the late 80s, 90s and pre-crisis 00s associate a high base rate with growing spending power. It also explains why, when you look at 2023’s bleak numbers, we’re wrong to do that today.

Source: Bank of England, The Office for National Statistics & Downing Fox Funds. NB: as at 31 March 2023; UK CPI figure based on latest available (February 2023).
To summarise; rushing back to cash today is not the obviously good idea it might first appear. If anything, it looks like an obviously bad idea. What can we do instead?
Which of the three assets below would you choose to store your own wealth?

So that’s asset A, B or C? Each asset’s bar shows the range of annualised real return (or loss) you could realistically expect to receive. This is based on the historical best or worst-case outcomes for each of them, using the last 120 years of data.
So which did you choose?
There’s no argument, right? I mean, you could bicker over whether A is better than B, based on how B’s worst-case might hurt more than its best-case delights. But the actual answer; C, is beyond debate: Both its best and worst cases are better than either A’s or B’s.
Life’s not like that, you may think. You can’t have extra reward and lower risk. So you’ve either made those assets up, or something’s missing.
Well, I didn’t make them up. They are, in order: UK cash; UK government bonds (gilts); and UK equities. Which means if you chose C, and why wouldn’t you, you chose equities.
But you’re right that something’s missing. That something is time horizon.
Look at Chart 4, taken from the excellent Barclays Equity Gilt Study (2018 edition). It shows the advantages of stretching your time horizon from one year (at the bottom) to 23 years (at the top – this is the data I used for Chart 3 above).

To explain; if you’re looking for historical guidance on holding an asset for just one year, the bottom set of three bars shows the best - and worst - real returns experienced over a single year since 1899. Note that this period includes two global pandemics, two global financial crises and two world wars (yet still only one English World Cup win).
So, for equities, in the best single year you almost doubled your money (wahey!), but in the worst you lost nearly 60% (woah!). This is what we think of when we imagine holding equities: a wild ride. And it’s why the usual advice, rightly, is don’t put it all in the stock market if you’ll need it back next year.
But, if you don’t need it soon, why should you pick one year to judge and not, say, five years? Notice how, as soon as you move up the chart to five years, the range of outcomes looks more like gilts and even cash (these are annualised returns, remember, i.e. how much you received per year on average over that five-year run).
And why not ten years? Now the worst case for equities is pretty similar to cash, but you have a chance of earning a lot more if it goes well.
And by the time you’ve stretched the holding period to 23 years? The UK stock market has never made a real loss over any single 23-year period. That might sound a long time, but it’s only the difference between 45 and the soon-to-be retirement age of 68. Or, if you’re 68, it’s what separates you and passing on your nest egg should you bat on to 91.
Here, for context, is how those timespans look when peering back from today’s viewpoint:

Source: FE Analytics. Total Returns. All time periods to 28.02.2023. Equities = FTSE All Share Index, Gilts = FTSE Actuaries UK Conventional Gilts All Stocks Index, Cash = The Bank of England Base Rate, “Stuff” = UK CPI.
So you can see that, as we stand today, for periods of five years and over, holding UK equities has boosted your spending power. But not over the last 12 months. Cash’s spending power, in contrast, has withered over all of those periods, including 23 years: A timespan over which UK equities have never shrunk your wealth.
Equity risk, then, appears to drop as the time horizon rises. Why does this happen?
It happens because, yes; over a single year equities are volatile. Their performance can be fantastic, terrible, or anything in between. But over longer periods there are more good years than bad, and the terrible years are cancelled out by the fantastic ones. In fact, often a fantastic year, like 2009 (+30.1%), is fantastic because it’s rebounding from a terrible year like 2008 (-29.9%).
Once this noise gets cancelled out, what you’re left with is closer to the ability of UK-listed companies to grow their profits over time. So the longer you hold, the more likely it is you’ll get this, and less likely you’ll get some crazy swing of the market. See the squiggles below from last quarter’s letter for an idea of what that looks like:

We’re back to putting the “real” into “what really matters”. Charts 3 and 4 show the returns made by assets after inflation has eaten into them. So those cash-loss scenarios are the periods in which inflation outpaced cash’s nominal returns (i.e. returns measured in currency, not in spending power).
2022 was one of those years. UK inflation was 10.1%, but the Base Rate averaged about 1.5%, so your saved cash lost a meaningful slug of its spending power.
If this sounds like we’re down on cash; it’s because we are. As I mentioned in our previous letter here, I think selected equities are the best assets for growing and storing my wealth, so I hold as much as I can.
But I still hold some cash personally, and we hold a decent amount in some of our portfolios too – why?
Because it’s less volatile in the short term. So, on a personal basis, I hold cash to cover any expenses – expected or otherwise – that might arise in the next few years, as I can’t rely on equities not having one of their wobbly years that close to now.
On a professional basis it’s because not everyone can handle the short-term volatility of a 100% equity portfolio. So we need to offer options for more volatility-averse investors that dilute equity returns in those terrible years like 2008 (i.e. to reduce the falls).
And as chart 4 showed, over a one-year period, cash is the most reliable diluter.
Gilts, in contrast, can be a diluter, but not always: Last year the UK gilt market fell by 23.8% (while the UK stock market rose by 0.3%)[4], and that’s before you account for 10.1% erosion from inflation. So, far from diluting poor equity performance, gilts added to it.
Clearly there are caveats here – most obviously this is based on past data, and the future’s unwritten. But it does at least cast these assets, and the concept of which is the riskier, in a different light.
That light suggests cash has its uses, but one of them isn’t protecting your wealth against the long-term effects of inflation. Not today, anyway.
There are other assets that have a better shot at doing that. Of the mainstream, liquid assets that can be held in a fund, we think selected equities – accompanied by a genuinely long and patient outlook - are the best bet.
If you’d like to know more about how we solve these, and other, investment conundrums, including how we navigated inflation’s dramatic return last year, give us a shout.
Likewise, if you’d like to receive this letter on a quarterly basis, drop us a line and we’ll make sure it happens.
And if there’s an investment topic you’d like us to cover in a future letter, please let us know. At Downing Fox we’re all about UK advisers and their clients, so if there’s something that’s vexing you, it’s most likely vexing other advisers too. It’ll be worth us taking time out to consider it.
Finally, if you’d like to use any of our charts for your own business, and could do with them in a more meeting-friendly format, I’m sure we can sort that out for you too. You know where we are.
If you'd like to subscribe to receive updates from Simon email downingfundmanagers@downing.co.uk.
[1] AllUK Base Rate data in this letter sourced from The Bank of England. As at 23March 2023.
[2] AllUK Inflation data in this letter is based on CPI, sourced from The Office for National Statistics.
[3] Maths with Simon: If you have £100, and “stuff” costs £100, then if your cash rises by 4.25% to £104.25, and the cost of stuff rises by 10.4% to £110.40, then:£110.4 - £104.25 = £6.15. £6.15 is 5.57% of £110.40. So you can now buy 5.57% less stuff. See Table 1.
[4] Source: FE Analytics: FTSE All Stocks Index and FTSE All Share Index, 31.12.21 to 31.12.22.
Risk warning: Opinions expressed represent the views of the fund manager at the time of publication, are subject to change, and should not be interpreted as investment advice. Please refer to the latest full Prospectus and KIID before investing; your attention is drawn to the risk, fees and taxation factors contained therein. Please note that past performance is not a reliable indicator of future results. Capital is at risk. Investments and the income derived from them can fall as well as rise and investors may not get back the full amount invested.
Important notice: This document is intended for retail investors and their advisers and has been approved and issued as a financial promotion under the Financial Services and Markets Act 2000 by Downing LLP (“Downing”). This document is for information only and does not form part of a direct offer or invitation to purchase, subscribe for or dispose of securities and no reliance should be placed on it. Downing does not offer investment or tax advice or make recommendations regarding investments. Downing is authorised and regulated by the Financial Conduct Authority (Firm Reference No. 545025). Registered in England No. OC341575. Registered Office: St Magnus House, 3 Lower Thames Street, London EC3R 6HD.
If you are a financial adviser, or discretionary fund manager call 020 7630 3319 or email us at sales@downing.co.uk
If you are a private investor call 020 7416 7780 or email customer@downing.co.uk